In today’s data-driven world, visualizing information through charts and graphs is crucial for decision-making, analysis, and communication. While creating charts and graphs manually can be time-consuming, advancements in artificial intelligence have introduced AI-powered tools that can generate these visuals automatically.
In this article, we’ll explore several AI tools that excel in creating various types of charts and graphs, enabling users to present data with ease and efficiency.
VizGPT.ai
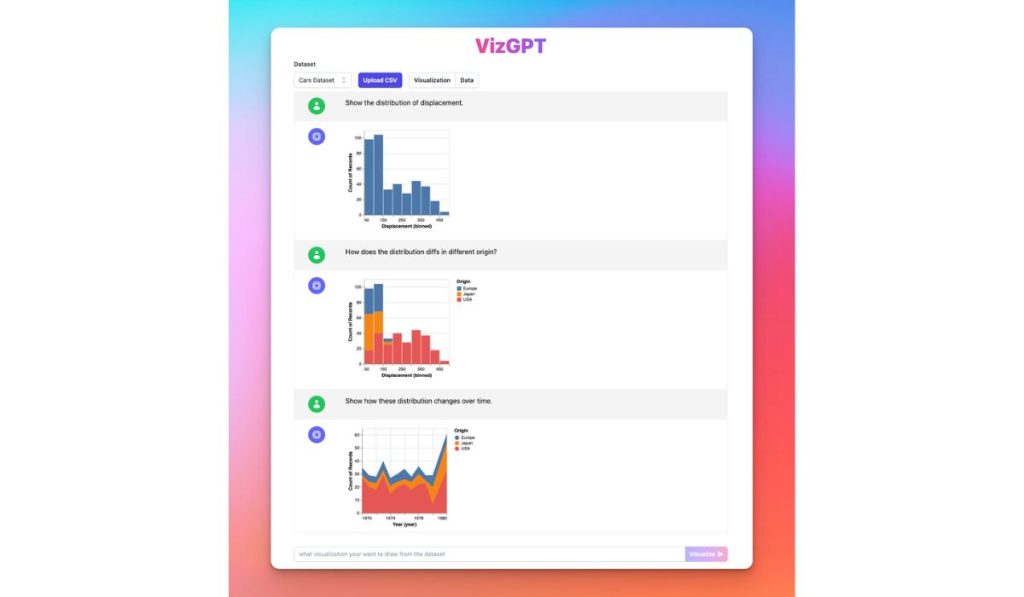
VizGPT stands out as an impressive AI-powered tool capable of generating charts and graphs from text descriptions. This powerful tool harnesses the capabilities of OpenAI’s GPT-3 language model, enabling it to create a diverse range of visualizations, including line charts, bar charts, pie charts, and scatter plots.
With VizGPT, you can turn complex data into meaningful visuals in a matter of seconds, making it an invaluable asset for analysts, researchers, and data-driven professionals.
Chartify.ai
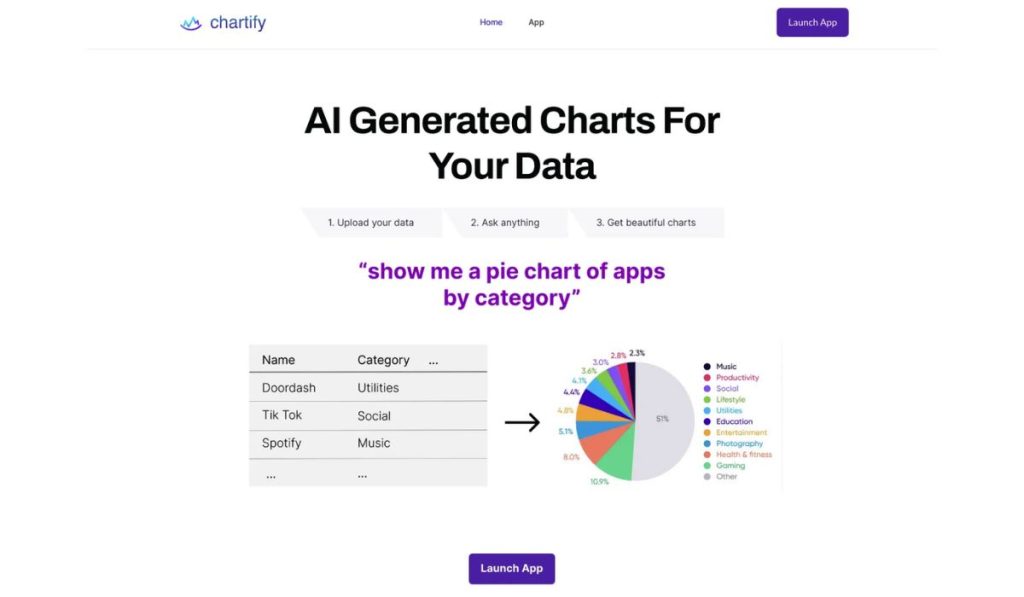
Another noteworthy AI-driven solution is Chartify, which leverages the powerful AutoML Vision API developed by Google AI. This advanced tool can generate charts and graphs based on text descriptions, just like VizGPT.
The AI capabilities of Chartify enable it to produce a wide array of chart types, including line charts, bar charts, pie charts, and scatter plots. Whether you’re a business analyst or a data enthusiast, Chartify can streamline the process of visualizing your data.
GraphMaker.ai
While Graph Maker isn’t AI-powered, it still earns a spot on our list for its user-friendly web-based platform that allows users to create charts and graphs from data with ease.
Although it doesn’t utilize artificial intelligence, its versatility and accessibility make it an appealing choice for individuals seeking a straightforward solution to visualizing data. Graph Maker offers a variety of chart types, making it suitable for various purposes and industries.
Appy Pie Free AI Graph Maker
Appy Pie’s Free AI Graph Maker provides a simple and easy-to-use tool for creating charts and graphs from data. While not as powerful as some of the AI-driven alternatives, it serves as a viable option for those on a budget or seeking a hassle-free solution for basic data visualization.
If you’re looking for a user-friendly experience without the need for sophisticated AI, Appy Pie’s Free AI Graph Maker may be the perfect fit.
Taskade AI Knowledge Graph Generator

Taskade’s AI Knowledge Graph Generator offers a unique approach to data visualization. While not specifically designed for creating charts and graphs, this AI tool enables users to create various visualizations, including charts and graphs.
Taskade’s focus on knowledge graphs means that users can visualize data in a way that’s easy to understand and explore complex relationships between data points, making it an intriguing option for those seeking creative ways to present information.
Datawrapper
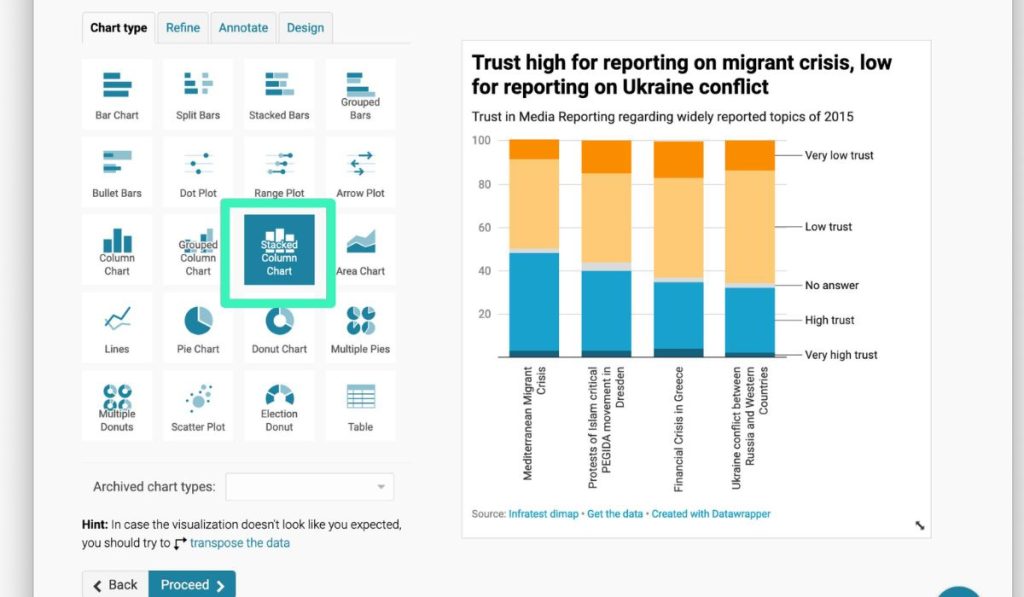
Datawrapper, like Graph Maker, isn’t AI-powered, but it’s still a highly valuable tool for creating charts and graphs from data. With a focus on offering power and flexibility, Datawrapper is a web-based tool that provides users with a range of chart types.
Additionally, it offers a free plan, making it an appealing choice for those who need a capable visualization tool without incurring significant costs.
These AI-Powered Chart and Graph Makers and More
The AI-powered chart and graph makers listed above represent just a few examples of the diverse range of options available to users today.
The best tool for you will depend on your specific needs, whether you prioritize advanced AI capabilities, user-friendliness, creative visualizations, or budget-friendly options.
Exploring these tools and their features can help you make an informed decision on which one aligns with your requirements.
In conclusion, AI-powered chart and graph makers have revolutionized the way we visualize and understand data. These advanced tools offer efficiency, accuracy, and versatility, allowing users to create impactful visuals effortlessly.
Whether you’re an analyst, researcher, or business professional, incorporating AI-driven chart and graph makers into your workflow can enhance your data visualization capabilities significantly.
Frequently Asked Questions (FAQs)
Are AI-powered chart and graph makers as effective as manually created visuals?
Yes, AI-powered chart and graph makers have proven to be highly effective in generating visuals. They can quickly analyze data and create accurate and visually appealing charts and graphs, saving time and effort for users.
Can these AI tools generate different types of charts and graphs?
Absolutely! These AI tools can create various types of charts and graphs, including line charts, bar charts, pie charts, scatter plots, and more. Their capabilities make them versatile and suitable for diverse data visualization needs.
Do AI-driven chart and graph makers require technical expertise to use?
While some tools may require some technical knowledge, many AI-powered chart and graph makers are designed with user-friendliness in mind. They often come with intuitive interfaces that allow users of all skill levels to create visuals effortlessly.
Can I use AI-generated visuals for professional presentations and reports?
A: Certainly! The visuals generated by AI-powered chart and graph makers are of high quality and can be used for professional purposes, including presentations, reports, and data analysis.
Which AI chart and graph maker should I choose?
The best AI tool for you depends on your specific needs and preferences. Consider factors such as the types of visuals you need, the level of automation required, user-friendliness, and your budget to make an informed decision.
Can AI-powered chart and graph makers handle large datasets?
Yes, AI-powered chart and graph makers are designed to handle both small and large datasets efficiently. They can process and visualize data from various sources, making them valuable tools for data professionals.